Progress Assessment Methodology

Technical notes
Last update: 4 March 2026
The Asia-Pacific SDG progress assessment is based on the global indicator framework for the Sustainable Development Goals (SDGs) and targets of the 2030 Agenda for Sustainable Development as adopted by the General Assembly on 6 July 2017 and further refined in subsequent years. Data for this analysis are primarily sourced from the Global SDG Indicators Database maintained by the Statistics Division of the United Nations Department of Economic and Social Affairs. When sufficient data on a defined SDG indicator are not available, additional indicators from internationally recognized sources are used. All indicators are available on the ESCAP SDG Gateway Data Explorer along with the information on country and territory groupings and definitions. To avoid bias towards larger economies, regional and subregional averages are calculated using simple averages rather than weighted aggregates. This section outlines the methodology used for SDG progress assessment.
Selection of indicators
Indicators are selected based on two criteria:
- Data availability: two or more data points for more than 50 per cent of the countries and territories in the relevant region or group;
- • Target setting: ability to define a quantitative target value.
If an indicator fails to meet either criteria, it is excluded from the analysis. The full list of indicators with their respective target values is contained in annex 2 of SDG progress report 2026.
Measures for tracking progress
Two principal measures are used to assess progress towards the SDGs: the current status index and the anticipated progress index. The indices answer two different questions:
- Current status index: how much progress has been made since 2015?
- Anticipated progress index: how likely is it that the target will be achieved by 2030?
The anticipated progress index measures the gap between the predicted indicator value and the target. Both indices are constructed at the sub-indicator (a sub-indicator being a series, disaggregation, or subcomponent of an indicator) and can be aggregated at the indicator, target or Goal level.
In this report, the current status index is presented at the Goal level (see the snapshot in figure 1; SDG progress report 2026) and the anticipated progress index is presented at the target level (see the dashboard in figure 2); SDG progress report 2026. Both indices are presented at the indicator level on the Asia-Pacific SDG Gateway. While the current status index aims to provide a robust measure across all 17 SDGs, limited data availability for some Goals and sensitivity to the addition of new indicators mean results should be interpreted with caution. Given the significant increase in indicators and data availability since previous editions, comparisons with earlier reports are not recommended.
Current Status (CS) Index
Given a specified SDG target value (TV) for each indicator (I), the values for the current year (Icv) and for 2015 (I0) are used to measure the progress since 2015, relative to the progress needed to reach the SDG target by 2030 (represented by the blue bar in figure 1).
Denoting indicator values for 2015 by I0 and for the current year by Icv and the target value for 2030 by TV, and setting the normalized values of the index to 0 for no progress and 10 for full achievement, the current status index is calculated as follows:
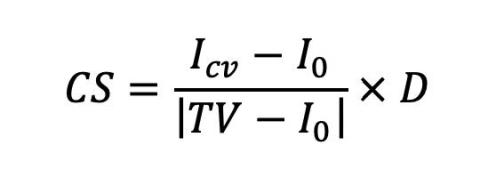
in which
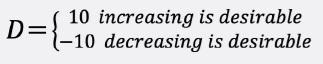
when a desirable direction (increase or decrease) is clear.
For parity indicators, the value is:
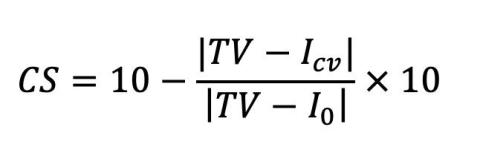
If the region (or country group) has progressed since 2015, the average overall normalized values under each goal provide an index between 0 and 10. But if the region has regressed, the value is negative and indicates the size of regression.
If the region (or grouping) has made progress since 2015, the average of the normalized values across all SDGs provides an index score between 0 and 10. Conversely if the region has regressed, the score becomes negative, indicating the extent of the decline.
For any indicator where the current value has already met or exceeded the target, the current status index is not calculated and is assigned a score of 10.
Anticipated progress index
This index measures anticipated progress with the targeted goal. It does so by projecting the indicator value for 2030 and benchmarking this predicted value against the target. The index provides a measure of how much additional progress will still be required by the end of 2030 to reach the target, assuming the current pace of change is sustained (see figure 2). Denoting the predicted value of an indicator for 2030 by It, the anticipated progress index can be computed by replacing Icv with It in the formulas for the current status index.
The anticipated progress index is only calculated for indicators that are not expected to achieve the target. When the predicted value has already met or exceeded the target, or when it is expected to reach the target by 2030, the indicator is automatically classified as “will be achieved”.
Based on expected progress, indicators are classified into three predefined achievement levels:
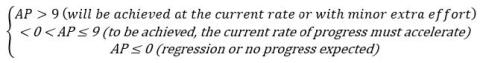
When applying both measures of tracking progress at the indicator level, an acceptance threshold of a minimum 2 per cent change is used to confirm progress or regression. In other words, the change is recognized only if the overall increase or decrease exceeds 2 per cent, depending on the desired direction of change.
Aggregation
A total of 170 indicators were used to compute the current status index for the 2025 SDG progress assessment. However, due to insufficient data, 12 indicators could not be projected for 2030 and were therefore excluded from the anticipated progress index calculations. When multiple variations of an indicator exist (for example health worker density), all variants are used in calculations. Each variant is assigned a weight such that the sum of the weights under the indicator is 1. A weighted average is then calculated to produce a single index value for that indicator.
Disaggregated statistics
Disaggregation by sex, location or a combination of age and sex is available for 27 indicators. To incorporate disaggregated statistics, a vulnerable group is identified for each group as the subgroup that is the worst off among all subpopulation groups. For each series, progress is then measured as the average of the progress achieved by the vulnerable group and the reference population. This approach ensures that progress on each series reflects improvements made in the most vulnerable group, thereby adjusting overall progress for equity considerations.
Extrapolation methods
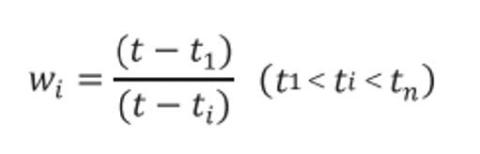
Producing the two measures of progress requires predicting and imputing missing values for both the current year and previous years. These estimates are generated using a weighted regression model that applies time-related weights, based on the assumption that the importance attached to the indicator values should be proportional to how recent the data are.
Suppose n data points are available for indicator I in a given region over a period of T years, and we aim to estimate its value for the year t.
T = tn – t1 where tn is the latest year and t1 is the earliest year, for which data on indicator I are available. The time-related weights work as multipliers that adjust the rate of change in each period in proportion to its temporal distance to the target year (t). The time-related weight for the ith data points for a given country, territory or region for estimating indicator values for the year is:
Weights are then incorporated into a regression model used for different indicators. In a few exceptions where the indicator is time-independent, time-related weights are not used (e.g., disaster-related indicators, official development assistance and other financial aid).
Setting regional target values
Of the 169 SDG targets, only 37 per cent have explicit or implicit target values. For the rest, target values have been set using a “champion area” approach, which leverages historical feasibility and optimizes the use of available data.
The approach works as follows:
- Identify the top performing countries in the region for a given indicator;
- Calculate their average rate of change and use this as the target rate for the region.
Conceptually, if all the top performers for a specific indicator were grouped into a single hypothetical area, the “champion area”, its rate of change would represent the benchmark for the region. If the region as a whole can match this rate from 2015 to 2030, the target value should be achieved.
The regional target value is then derived by applying the champion area’s rate of change to the regional baseline (average indicator value across all countries and territories with available data). In cases where the champion area approach cannot be applied, the average value of the top five performers (based on the latest available data) is used as the regional target.
Trend assessment (section 1.3; SDG progress report 2026)
At the national level, the assessment in this report focuses on analysing the trends in the absence of widely adopted target values by countries. For a given indicator, the direction of change over time toward or away from the desirable direction determines whether it is classified as a positive or negative trend. Likewise, when the change is less than 0.5 per cent, then an indicator is classified as stagnant. To aggregate the score for each SDG Target, the following scoring is used for averaging the performance at the indicator level:
- 1 for positive trends,
- 1 for negative trends,
- 0 for stagnant trends.
The trends in SDG Targets are classified as positive or negative based on thresholds of 0.25 or –0.25, respectively. Otherwise, a stagnation is assumed. The chart (Figure 3) is presented at the Goal level, showing color-coded proportions of SDG Target with positive trends for each country and territory. In-depth analysis of trends can be found in the Asia-Pacific SDG Gateway.
Evidence strength – sufficiency of indicators at goal level
Due to limitations on the availability of indicator data, Goal-level results are based on a subset of the global indicators. The strength of the evidence is thus calculated using the following ratio:
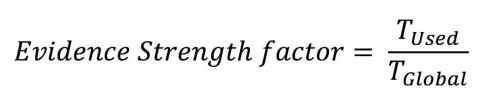
where TGlobal represents, the total number of indicators in the global indicator framework and TUsed represents the number of global SDG indicators used in the calculations.
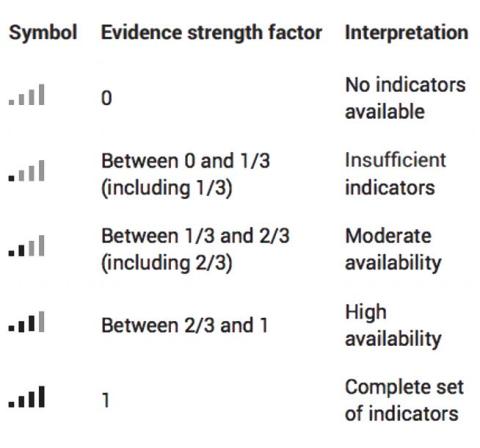
For ease of analysis, a strength symbol denotes the evidence strength factor according to the table below.
References
- Indicator guidelines for policy monitoring in the Pacific
- Regional aggregates: Masking change in regional disparities? (ESCAP: SD Working Paper)
- Tracking progress towards the SDGs: measuring the otherwise ambiguous progress (ESCAP: SD Working Paper)
- A weighted extrapolation method for measuring the SDGs progress (ESCAP: SD Working Paper)

Statistics Division
ESCAP, The United Nations Building, Rajadamnern Nok Avenue Bangkok 10200, Thailand.


